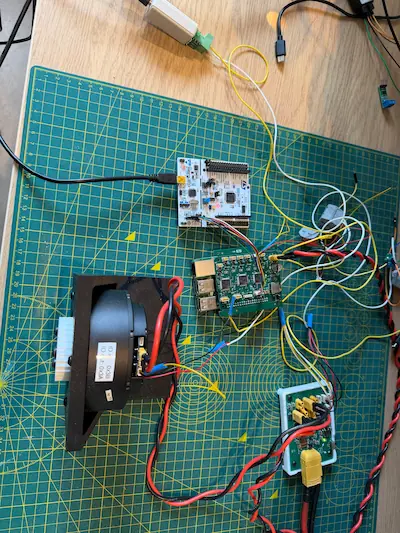
To help with debugging the system and understanding what’s happening, I built a GUI that translates the CAN bus activity to something more digestible.
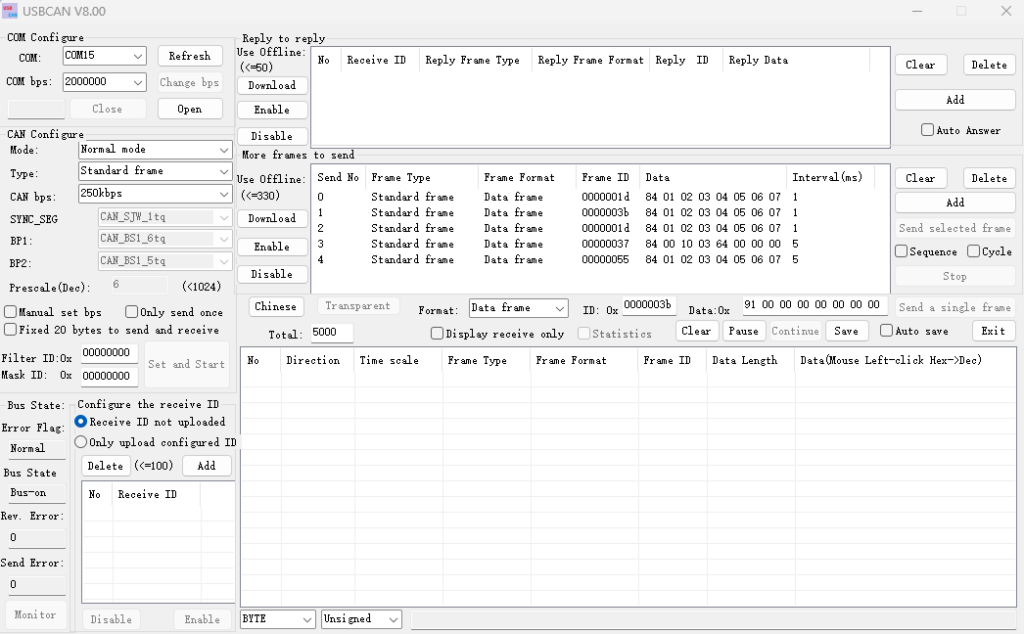
Up until now I’ve been using the USB-CAN Analyzer from Seeed Studio, available on Github – SeeedDocument.
This has been fantastic so far for helping track down the issues I’ve encountered.
It is limited in that it only shows the raw message which I’m not currently capable of interpreting quickly.
To help bridge the gap, I thought it would be helpful to have a GUI that connects to the in a similar way, but is able to do the interpreting live. I recently was introduced to qt-designer in PySide6 so was able to apply this to get it set up building on my existing Steady Win and CAN Dongle python modules.
The GUI currently looks like the below.
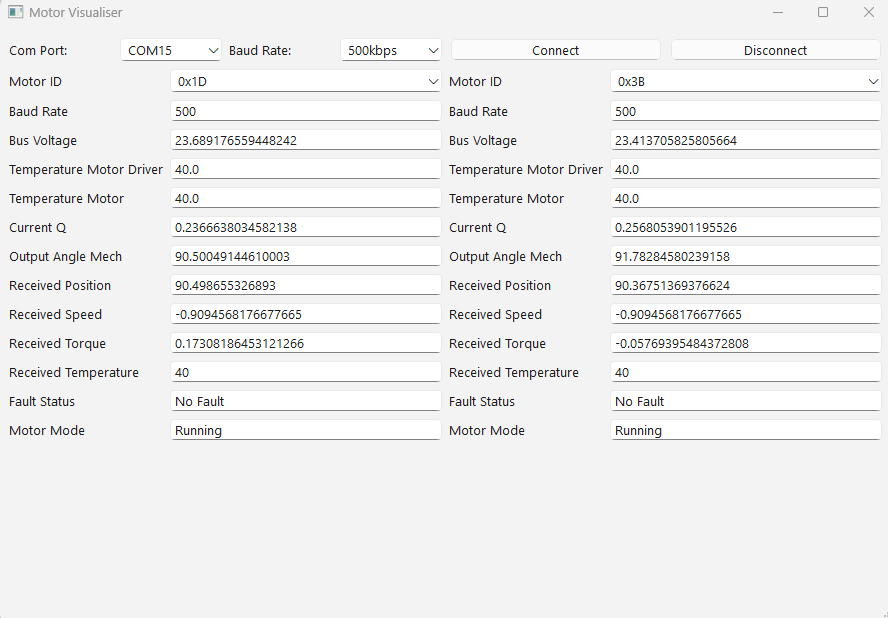
While not super attractive, it can do the following:
- Connect to two motors simultaneously
- Select a valid COM port (generated at startup from what’s connected)
- Set the baud rate to 500kbps or 1Mbps
- Listen on the bus and update Configuration items, Indicators, Fault status, and Motor mode
- It’s also interprets the response from control commands, something I am yet to include in the C driver
In the future, I’d like to upgrade it with the following:
- All motor configuration, indicator, and parameter items. Ideally with a way to collapse each for a clearer view.
- Have more than 2 motors connected. The robot has 9 motors which may or may not be on the same CAN bus.
- The ability to fetch and acknowledge faults.
- Plotting of position, torque, and speed.
- Possibly modify motor configuration, indicator, and parameter items.
- Control motor behaviour