Goal:
Create a load cell for the Dynamometer project.
Still very much a work in progress.
Current State
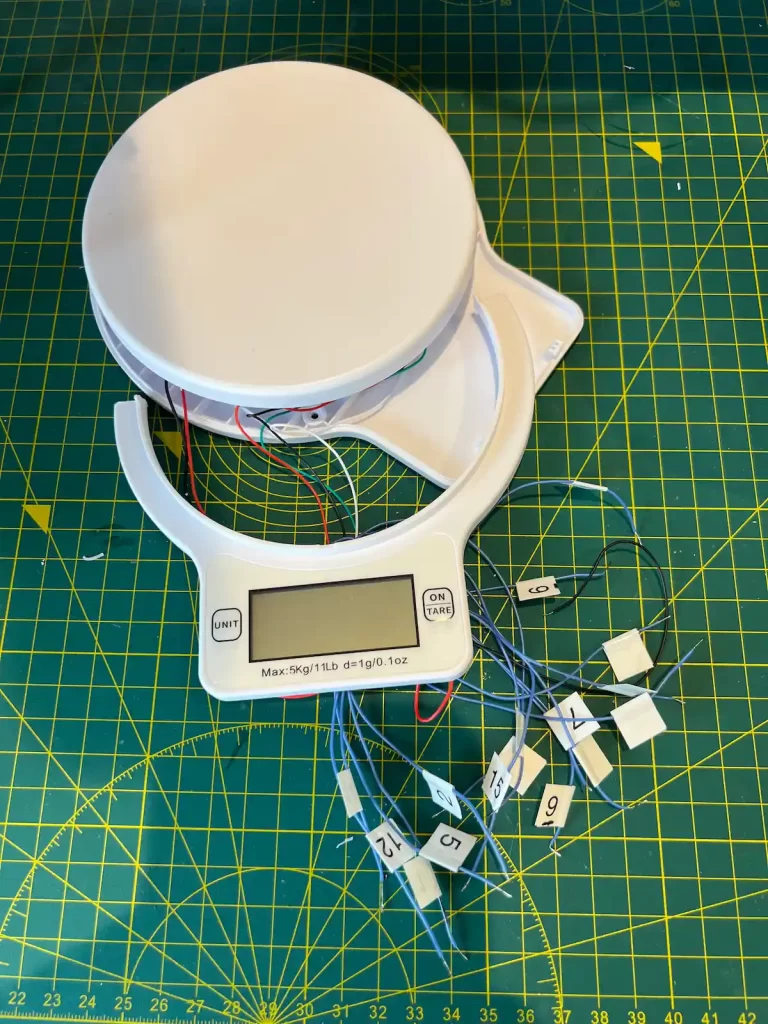
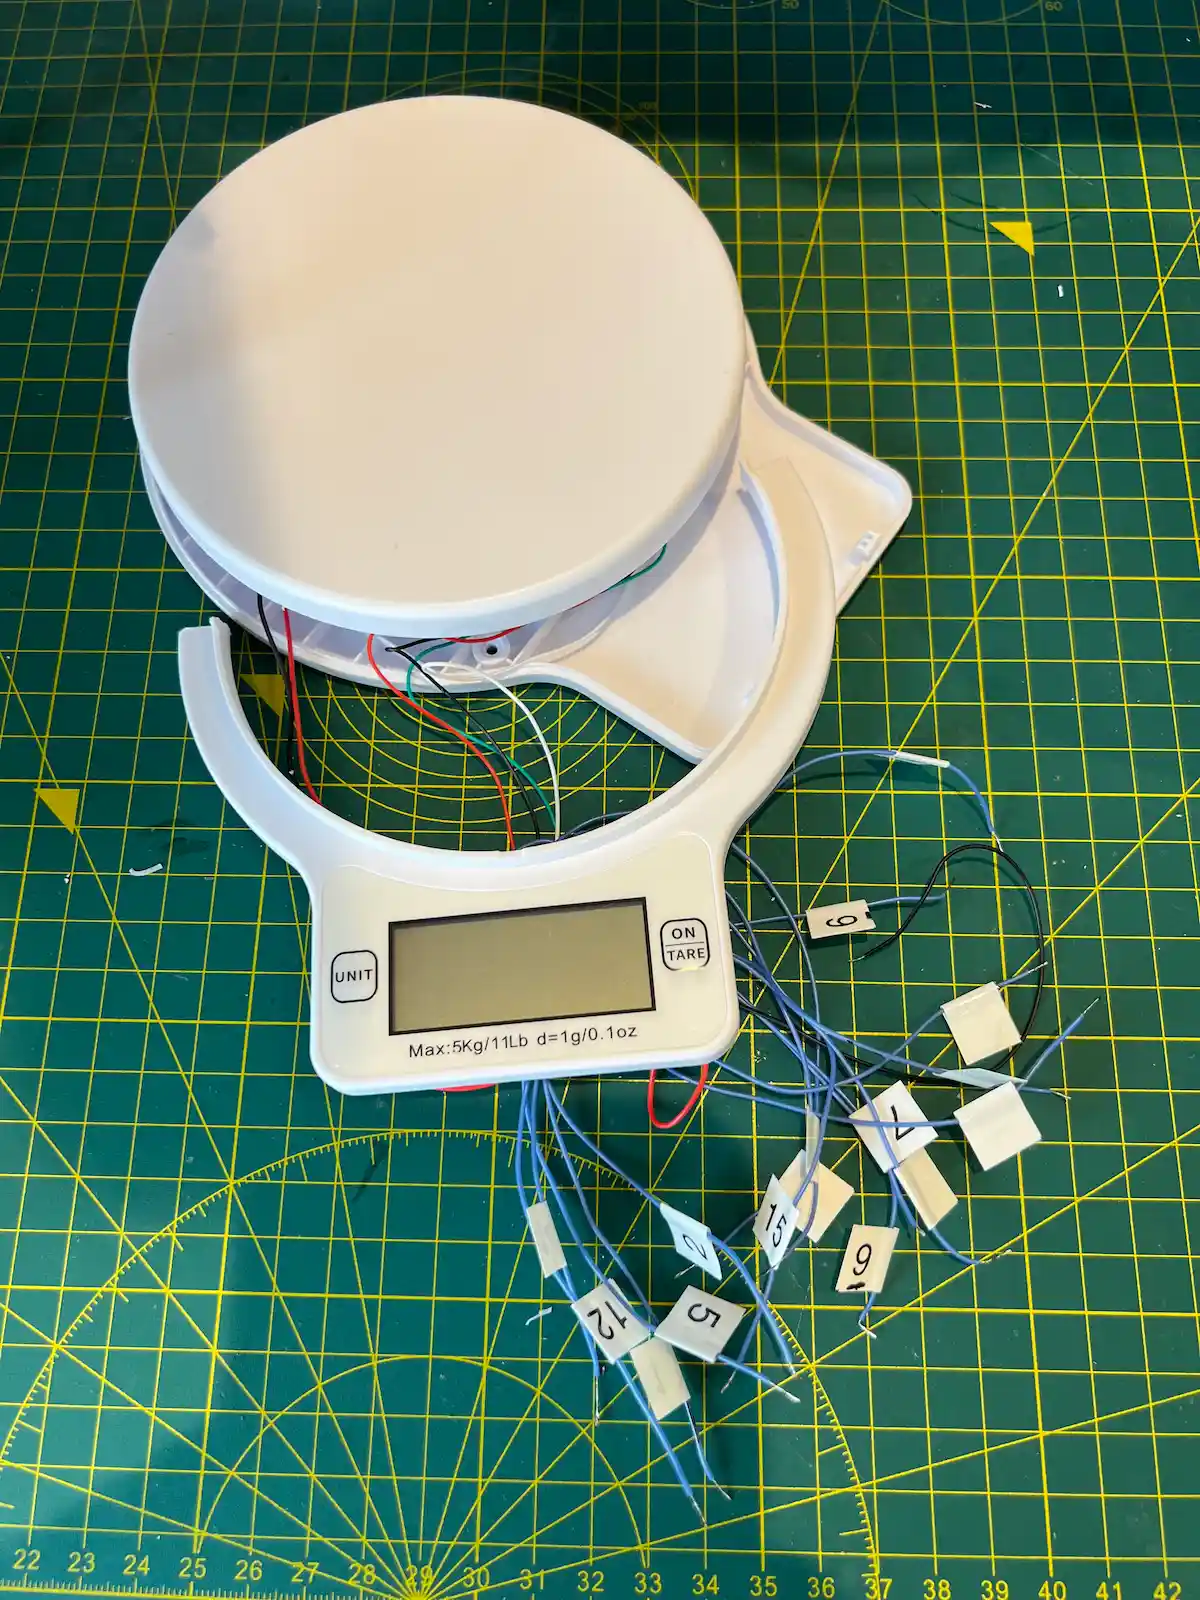
The current system consists of the hardware with 15 output lines from the scale (not all needed) and an algorithm to convert the voltages on the lines to what the scales display.
Scale and outputs
The scale is made up of several components.
- LCD Screen
- Load cell
- PCBA
- Plastic Hardware
LCD screen displays the scale reading, in metric or imperial depending on the selected mode.
Digits are in a seven-segment style with several other sections for units, mode and separators.
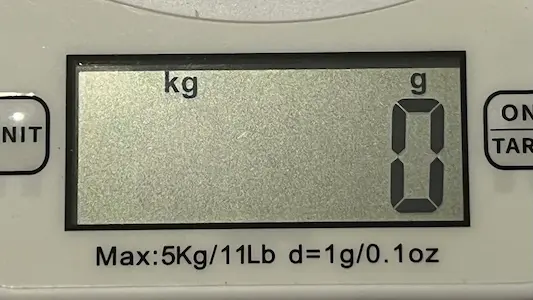
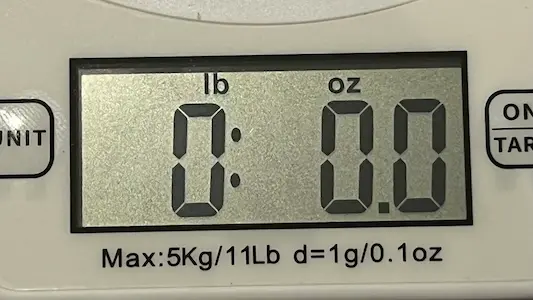
The LCD connects to the PCBA through an elastomeric connector with 16 channels, these channel signals control what the LCD displays.
These channel signals from the PCBA were used to determine the load on the cell.

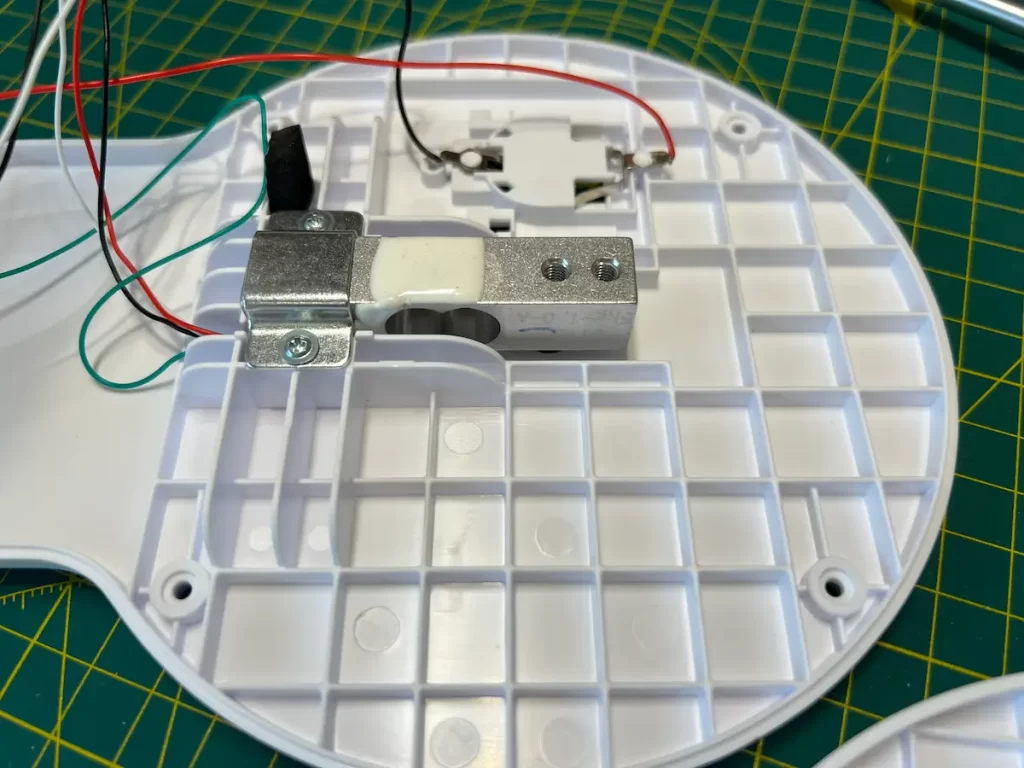
The Load cell is in a cantilever beam configuration with, I assume, strain gauges to determine a change in beam deflection.
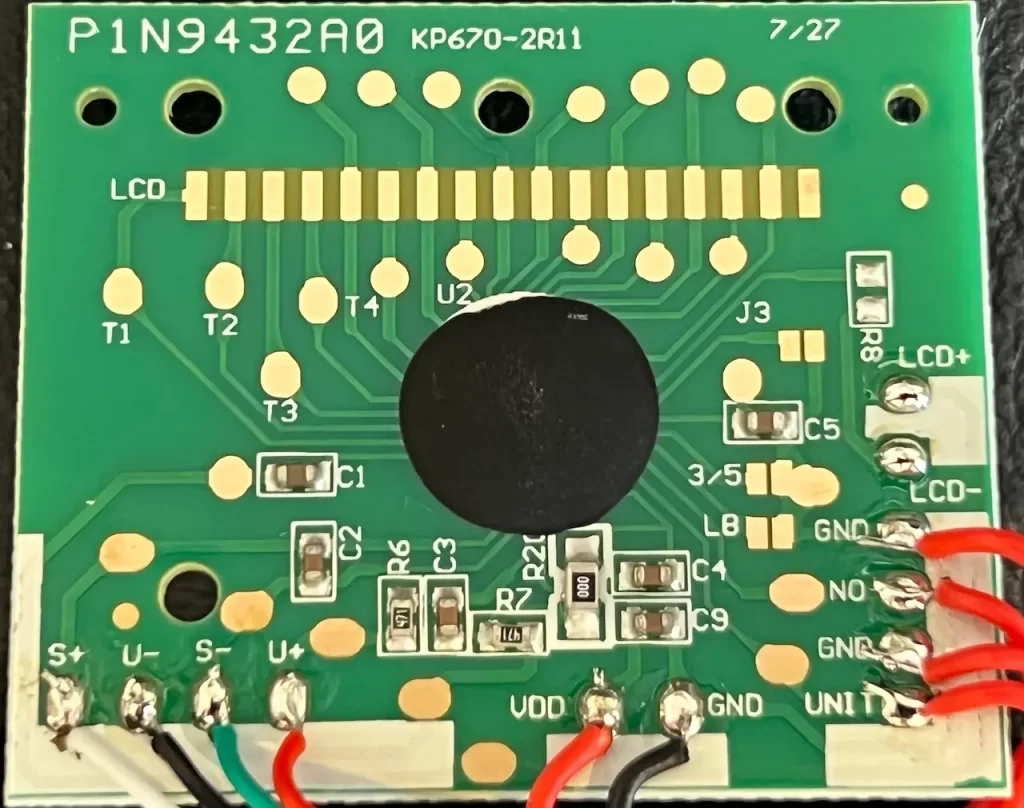
The PCBA has 4 lines that go to these strain gauges (S+, S-, V+, & V-).
I wasn’t able to significantly measure any voltage changes on these lines with deflection.
The PCBA contains, along with the various outputs to the LCD and strain gauges, a larger number of test points (thankfully), a processor and leads to two buttons.
– ON/TARE
– UNIT
Algorithm
Converts from LCD driver line to LCD display, and vice versa.
The LCD driver line input data is an array of 16 rows and 4 columns representing the 16 channels and the 4 time steps in the display cycle.
From this array it maps to which segments the display is showing at that time.
If there’s any interest in the algorithm then I could possibly add a link to it on Github.
Approach to Obtaining the Algorithm
Initially, I looked at voltages measured straight from the presumed strain gauge but didn’t observe any link between the voltage reading and what was being weighed. My assumption is the voltage sensitivity I could measure to was not enough.
The second approach was for each signal line going to the LCD zebra connector and a ground pad had a wire connected to its test point.
A weight (random item) was added to the scale and the 14 signal lines vs ground were measured on a scope.
These signal lines were reading at 4 voltage levels (0, 1, 2, & 3volts), each distinct value I then treated as a “bit” of information.
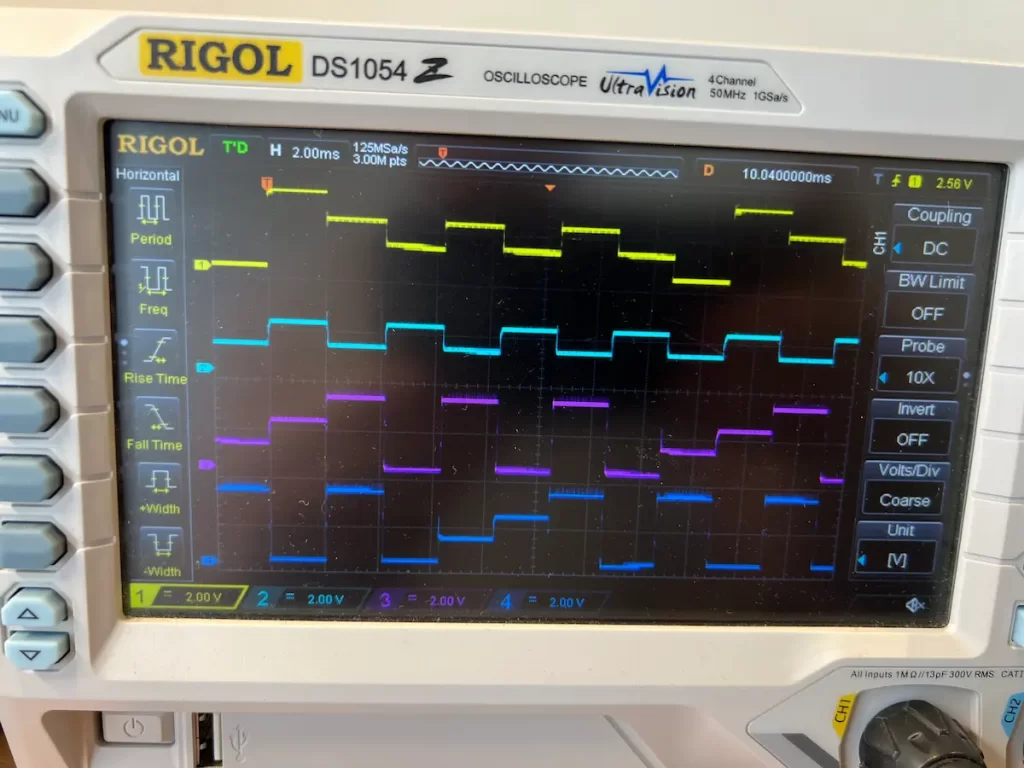
Each line had a pattern that repeated after 8 “bits”.
With my oscilloscope being limited to 4 channels, I kept channel 1 connected to signal 1 and rotated the other 3 channels through the remaining channels, this helped me keep them synchronised to build up a matrix of values per load.
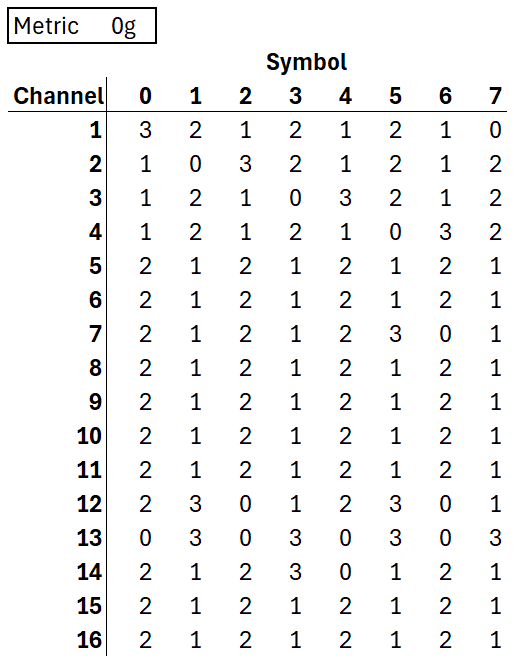
This was repeated with a few other weights and scale modes to try and span all the various LCD segments.
I put them into excel to try and figure out the connection.
Initial basic observations:
- Not enough signal lines or info for 1 channel per segment
- Channels 1 to 4, 15 and 16 had consistent pattern across all measurements
- This meant I could cut down on the number of channels needed for collecting additional data
- The “bits” came in pairs.
- Every sequence always had a 0 and 3 level together and a 1 and 2 level together.
- This lead to shifting the bits I’d recorded so they were in pairs, I dubbed 0,3 as a 1 and 1,2 as 0. Taking each signal to 4 bits.
Deeper Analysis
- Channels 15 and 16 four bits were always 0.
- Channels 1 to 4 each had only one bit as 1 with three bits as 0s.
- Each channel had their “1 bit” at different locations.
- Channel 1: 1 0 0 0
- Channel 2: 0 1 0 0
- Channel 3: 0 0 1 0
- Channel 4: 0 0 0 1
- My assumption was these were linked with rows for the segments.
That is, a column and row need to both be 1 for a segment to be turned on.
A technique I’d seen used for displays to minimise the number of driving lines needed.
- Each channel had their “1 bit” at different locations.
- With the remaining unmatched segments and channel signals I worked through to identify pairings.
- Each frame I gave a number, and each segment within the frame I gave a letter and looked for a 1 to 1 mapping between signal and segments.


- Initially some were easy, for example negative and imperial/metric.
- Across the various loads, there were many common segments that were always on with others so were not easy to attribute links between signal and symbol
- Groups of signals were logically AND’d together with each other in various combinations to try and isolate specific segments and signals together.
This approach was performed with the channel voltage data and also the shown segments data.

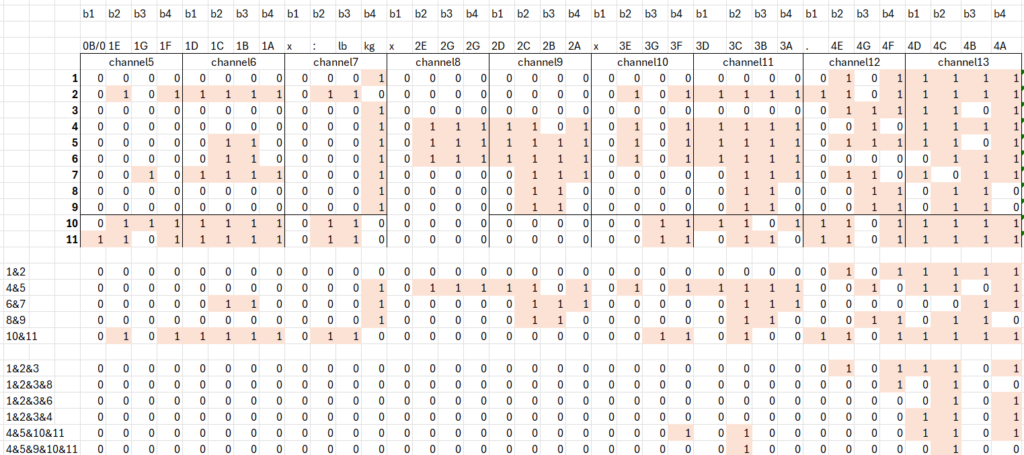
- This was repeated for different combinations of signals and slowly identified more mappings
- Sometimes I had to make an assumption on whether a signal was in one place or another.
I tried to rely on the likelihood there’d be a link between the physical location of a segment on the LCD and the channels. - A few more different loads were applied to get more combinations to both verify what I had and identify more mappings
- After some time I saw a pattern of how signals were mapped and linked across frames, by columns and rows, and was able to guess what the unknown spaces likely were.
- I narrowed in my focus on verifying these, which was successful.
I then used python to map between them and verify the mappings I’d determined.
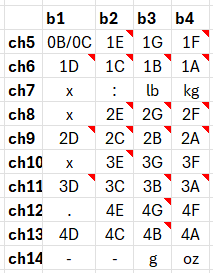
Future goal
- Take the map of which segments are displayed and generate actual values internally.
- Packaged with a simplified electrical output that can be interfaced
- For example, an external device can send a measure request to the load cell and have the reading returned.
- The current approach of using the LCD signal limits the rate at which load values can be taken, converted and transmitted.
LCD Information I want to learn more about
There are several display channels that don’t have an obvious input on which segments are shown.
I would love to confirm what their purpose is for, my assumption is that they are electrical return paths.
The signals themselves operate in an alternating voltage of 0V to 3V, or 1V to 2V.
How and why is this needed by the LCD, does it need a square wave signal to drive the segments in a capacitive approach (with the 1.5V DC offset effectively being ignored)?
Until next time.

